Showing posts with label Remote Sensing. Show all posts

Friday, 10 December 2021

Basics: Drones in Agriculture

With increase in population, food security remains the main global challenging problem. For this, yield optimization has been the most important necessity, not just in increasing the yield but in its quality as well. As the solution, Unmanned Aerial Vehicle or UAV are used in the agricultural applications, whose other terms are Unmanned Aerial System (UAS) and Remotely Piloted Aerial System or RPAS in the legislative uses. In the general terms, however, the term drone is the most popular which can be understood as the flying aircraft without humans although interventions are necessary to operate it. The drones assists us to visualize the crops in other spectra of electromagnetic spectrum acting us the addition in our crop monitoring process.

Wednesday, 24 November 2021

Drones related policies in Nepal [LINKS]

These are the drones related policies/documents in Nepal listed as the bookmark. Updates will be done as per the changes in the future. 

Drone related procedure, 2019
    -guides drones under the law, requirements of registration, and rules to be followed by the users (in nepali language)
    -defines the nepalese term मानवरहित हवाई उपकरण (direct translation: man-less flying tool) similar to english terms: Remotely Piloted Aircrafts (RPA), drone, UAS, UAV

Flight Operations Directives No.7
    -provides information on small unmanned aircraft, small unmanned surveillance aircraft, and small unmanned aircraft operations

Thursday, 30 September 2021

Terms: Change Detection

Change detections are 

-based on spectral classification of the input data such as post-classification comparison and direct two-date classification and 

-based on radiometric change between different acquisition dates,

----image algebra methods such as band differencing, ratioing and vegetation indices; 

----regression analysis

----principal component analysis and 

----change-vector analysis


Lu et al, (2004) generalized the change detection methods into seven types, namely, arithmetic operation, transformation, classification comparison, advanced models, GIS integration, visual analysis and some other methods.

~Pixel Level Change Detection Techniques:

Image Differencing

Image Ratio

Image Regression

Post level Comparison

Multidata direct comparison

Artificial Neural Network

Support Vector Machine

Decision Type

GIS based

Multi temporal spectral mixture analysis

Fuzzy change detection

Multi sensor data fusion


~Feature Level Change Detection

Vegetation Index differencing

PCA

Kauth Thomas Transformation KT

Change Vector Analysis

Gramm-Schimdt GS

Chi-square

Texture Analysis


~Object Based Change Detection

Image object change detection

Class object change detection

Multi temporal object change detection

Hybrid change


Terms Collected from 

Remote Sensing & GIS based Approaches for LULC Change Detection – A Review

Remote-Sensing-GIS-based-Approaches-for-LULC-Change-Detection-A-Review.pdf (researchgate.net)


Tuesday, 21 September 2021

Notes: SAR for crops

RADAR stands for Radio Detection and Ranging which uses longer wavelengths compared to optical remote sensing and they can be active; producing their own source of energy.  


Terms:


Slat Range: radar antenna and target’s distance


Ground Range: satellite ground target and target


Azimuth: along track direction or distance


Incidence angle: angle between the line of sight of radar and vertical to the terrain


Range resolution: depends on the length of the pulse


Azimuth resolution: determined by antenna beam width and distance to the target


Wavelength and frequency: between 0.5 cm to 100cm frequencies


Radar polarization: orientation of the electric field of the electromagnetic wave, the polarization can be like polarized (HH, VV), cross polarized (HV, VH), and compact polarized  (transmitting right circular and receive H and V coherently)


SARs respond to two characteristics in the agriculture land: structure and moisture: 


Roughness: caused by tillage, soil erosion and weathering in the land or planting, backscatter increase with increase in soil roughness and the rougher soils appear brighter in the SAR images. The criteria of the soil roughness depends upon the wavelength and the incidence angle.


Strong backscatter when the SAR looks direction perpendicular to the direction of the rows; not present in HV and VH. 


Dielectric constant is when the dipolar molecules rotate response to the applied field. The presence of water molecules rotates to align with the field. More water in the target means higher  backscatter with higher returns. 


The vegetation effects depend on the structure of the plant (type of the crop and the growth stage of the crop) and the presence of the water in the canopy at the molecular effect. The scattering can however be complex: multiple scattering from the canopy structure itself, direct scattering from the soil, or from the canopy, or multiple scattering from the soil and the canopy. 


The canopies can attenuate or scatter microwaves, and also depends on the canopy components such as the wavelength itself. 


The best frequency depends on the soil moisture and canopy (how deeper we want to penetrate) 


Polarization:

V-polarized: couples with vertical structured vegetation and energy attenuated

H-polarized: greater penetration through canopy to underlying soil

Cross polarization: sensitive to target volume  and not affected by row effects

HV or VH is best for either crop identification or crop biophysical estimation,


Incident angles: should not be mixed for temporal change detection


Rough Notes from: 

Saturday, 18 September 2021

Notes: SAR in flood mapping

Flooding means the water presence in the ground surface below or above vegetation, or the presence of water in the surface which would not be in normal cases. SAR imagery has been used in studying, understanding and interpreting the study of the floods. The benefits of the SAR include the ability to collect images both day and night, and in any weather conditions and the appearance of the water surface appearing black compared to other surfaces. SAR signals can scatter in different ways based on whether the surface is smooth or rough, and can be affected based on the size of the object on the surface, their position in the surface and the numbers (or presence) of such structural surfaces. 

The practicality in SAR is the type of wavelength’s ability to penetrate the target (L-band having more penetration capability than C-band). L-band or P-band, in flooded areas with dense forest can be more interpretative compared to C-band (bands getting mixed between surfaces).


The advantage of SAR, being in the  ability of polarization, is used for determining the different physical properties of the object. The selection of the polarization depends on the place of flooding as well; different polarizations need varying analytical interpretations based on whether the flooding is in the open space, in the forest areas with presence of dense or sparse forest or vegetation or in the city areas with buildings or human habited places. The expert SAR users have selective choices and preferences in the selection of the polarizations based on the knowledge of the locations and their previous experiences; most selections based on the research.


Incidence Angle (depends on the swath) results high or less backscatter, and less incidence angle in surface scattering makes the surface appear more brighter. Such causes along with distortions can make interpretations of the flooded areas a difficult task (but selection of the proper data even more challenging). The needs are in understanding more of the backscattering mechanism in different flood surfaces.


Publicly available:

https://doi.org/10.1080/22797254.2020.1859340

https://doi.org/10.3311/FloodRisk2020.7.5

http://dx.doi.org/10.1109/JSTARS.2021.3083517

https://doi.org/10.1111/jfr3.12744


~posted as the content creation in the page.


Thursday, 16 September 2021

Notes: Crop Yield Forecasts

The needs for forecasts are in the warning system. It requires crop simulation models CSMs, equational representation of the crop growth, and yields which plays important roles in the understandings of the agronomic results, and they are only the approximating the real world.

CSMs: 

statistical models

functional models

mechanistic models

simple models: across large land areas based on statistics of climate and historical yields, lesser details of soil plant system


CSMs relies on the meteorological data, agrometeorological data, soil data, remotely sensed data and agricultural statistics; different indices have been developed based on them. Standard regression techniques are applied which is called model calibration which results yield functions, which estimates the yield. The accuracies heavily relies on the input statistics.

Agrometeorological model:

Weather can have huge impact on all the process of crop growth and yields. Yield variability can be considered due to large impacts of the weather. Balaghi et al. (2013) used the rainfall as the main indicator for the crop yield variation in Morocco. In tropical countries, other factors such as soil moisture, and other meteorological factors should be considered. 

European Commission's Joint Research Center (JRC) used Biophysical Models Applications (BioMA) to simulate various crops in agricultural systems under different scenarios. Statistics and AAFC, Canada works on the model that can predict crops based on low resolution satellite imagery, historical crop survey estimates and agroclimatic information. Remote sensing information to predict wheat yields have already been proposed in 2014 for the insurance industry in Australia.


Remote Sensing Model;

Vegetative Indices (VI) have been used in monitoring of the green vegetation which shows the biophysical parameters in the crops. NDVI, proposed in 1978 by Deering is the most popular which directly relates with LAI and photosynthetic activity of the green vegetation and indirectly with Fraction of Absorbed Photosynthetically Active Radiation (fAPAR).  

FAO used the Agriculture Stress Index System to detect areas with water stress. The use was of Vegetation Health Index (VHI), derived from NDVI and Temperature Condition Index (TCI) derived from thermal infrared band from AVHRR. 

Mahalanobis National Crop Forecast Centre (MNCFC) of India combines agrometeorological models with remote sensing data for preharvest productions of the crops. Crop cutting experiments are also done to train the models. Brown et al. (2009) used NDVI to forecast the price of food using NDVI information. Similarly, NASS has attempted to used remote sensing for acreage estimation since 1972 and the applications of remote sensing has been expanded to other applcations. 


Abstracts from 
Handbook on remote sensing for agricultural statistics Chapter 6.4 


Thursday, 9 September 2021

Notes: How is SAR responded?

 SOIL:

Greater reflectivity due to higher dielectric constant of water; presence of water in soil means the easy detection from the longer wavelength.

VEGETATION:

Vegetation will have volume scattering. Similar the scattering from the soil may result in further scattering; thus wavelength of 2 to 6 cm is better as volume scattering is more and the scattering from the surface is reduced. Longer wavelengths of 10 to 30 cm can be suitable for trees. HH or VV (like polarized are able to penetrate more in vegetation compared to HV or VH (cross-polarized waves). If the crops are aligned in azimuthal direction, more energy is received compared to range direction. 

MOUNTAINS:

The SAR while observes, all the mountains seems to be located at the same distance or the same point from the spacecraft; this is called foreshortening or layover. It happens because all the backscattered signals return to the spacecraft at the same time. 

WATER / ICE:

Smooth water has no results to the antenna. 

For sea ice, the age, roughness, geometry, and other factor may play the role in its detection.


~Regions of calm water and other smooth surfaces appears black as all the incident radar are reflected.

~Surface roughness (rough surface) appears more bright when wet. Surface variations (near the size of the radar's wavelength) can cause strong backscattering.

~Waves in the water surface close to the size of the incident's wavelength can cause backscatter.

~Hills or mountains appear bright on the side that faces the sensor and dim on the other side. Human made structures appear bright acting as corner reflectors. They may appear as a bright cross if the response is strong. 


IN AGRICULTURE:

the use is for 

~soil moisture detection and monitoring: developing soil moisture maps, monitor the effectivity of the irrigation system, flood probability, 

~crop studies and acreage determination: for knowing crop health, plant stress, and timely suggestions in fertilizer application 

~damage mapping from pests or abiotic factors

use of multi-temporal techniques for different dates


Source: esa ASAR Product Handbook

(as part of  learning)


Friday, 3 September 2021

Notes: Platforms for Big EO data

The following texts are the extracts from the research article. All the texts have been copied and very little edits have been done and have been presented for the study purposes.

An Overview of Platforms for Big Earth Observation Data Management and Analysis https://www.mdpi.com/692396  

  1. Google Earth Engine:

It is the cloud-based platform for large-scale scientific analysis and visualization of geospatial datasets as a free service based  on Google’s infrastructure

GEE provides a JavaScript API and a Python API for data management and analysis. There are four object types to represent data that can be manipulated by its API. 


The Image type is the raster data (one or more bands, with name, data type, scale, and projection). The time series of Images is by the ImageCollection type, vector data by the Feature type. This type is represented by a geometry (point, line, or polygon) and a list of attributes. The FeatureCollection type represents groups of related Features and provides functions to manipulate this data, such as sorting, filtering, and visualization.


To process and analyze data available in the GEE public catalog or data from the user’s private repository, GEE provides an operator library for the object types.


The GEE library has over 800 functions for handling big EO data sets. Despite this large number of built in functions, these functions are close and users can not update or extend their basic functionalities. While GEE provides a friendly environment for scientists, the implementation of procedures that are not available through the GEE API functions requires significant user effort. Besides that, GEE only offers programming interfaces that support pixel-based processing, and there are natively no region-based methods such as image segmentation or large-scale time series analysis. Users can share their scripts and assets with other users of the platform. Nevertheless, it is important to keep in mind that these scripts use algorithms implemented internally by the platform and that these algorithms are close and can not be extended on the server side.


  1. Sentinel Hub:

 The platform is developed by Sinergise that provides Sentinel data access and visualization services. This is a private platform with public access (https://www.sentinel-hub.com). Unlike Google Earth Engine, SH limits access to functionality in different payment plans. The free plan only allows viewing, selection and downloading of raw data. Paid access enables data access through OGC protocols and a specific API, data processing, mobile application data access, higher resource access limits, and technical support .


SH uses the concepts of Data Source, Instances and Layer to represent the data available in its services. Data Source is an abstraction equivalent to the GEE ImageCollection, 


An Instance in SH platform acts as a distinct OGC service that can be configured to provide a set of Layers that fulfill user needs. Each Layer is associated with one or more bands of a specific Data Source and a processing script. These scripts, called Evalscripts by the SH, are applied to each pixel of the data requested by the user. It is not possible to access the data of a pixel’s neighborhood during the execution of the script, which can basically perform operations between bands.


  1. Open Data Cube:

Previously known as the Australian Geoscience Data Cube (AGDC), it is an analytical framework composed of a series of data structures and tools that facilitate the organization and analysis of EO data. It is available under Apache 2.0 license as a suite of applications

The source code of ODC and its tools are open and are officially distributed through dozens of git repositories (https://github.com/opendatacube).


  1. 2.4. SEPAL

The System for Earth Observation Data Access, Processing and Analysis for Land Monitoring (SEPAL) is a cloud computing platform developed for the automatic monitoring of land cover. It combines cloud services, such as Google Earth Engine, Amazon Web Services Cloud (AWS), with free software, such as Orfeo Toolbox, GDAL, RStudio, R Shiny Server, SNAP Toolkit and OpenForis Geospatial. The main focus of this platform is on building an environment with previously configured tools and on managing the use of computational resources in the cloud to facilitate the way scientists search, access, process and analyze EO data, especially in countries that have difficulties with connection with the Internet and few computational resources 


SEPAL is an initiative of the Forestry Department of the United Nations Food and Agriculture Organization (FAO) and financed by Norway. Its source code (https://github.com/openforis/sepal) is available under MIT license 


 It can be accessed through a web portal (https://sepal.io)


  1.  JEODPP

The Joint Research Center (JRC) Earth Observation Data and Processing Platform (JEODPP) is a closed solution developed since 2016 by the JRC for the storage and processing of large volumes of Earth observation data. This platform has features for interactive data processing and visualization, virtual desktop and batch data processing. This platform uses a set of servers for data storage and another set for processing. The storage servers use the EOS distributed file system and store the data in its original format, with only pyramidal representations added to speed up the reading and visualization of the data.

The JEODPP does not have tools to facilitate the sharing of analysis among researchers. This capability is only available for internal use of JRC and there is no source code available for implementation in other institutions.


  1.  pipsCloud

pipsCloud is a proprietary solution developed by Chinese research institutions for the management and processing of large volumes of EO data based on cloud computing. The file system used in pipsCloud is HPGFS, a proprietary file system also developed by Chinese institutions and which is not available for use by third parties. Its cloud environment is implemented in the organization’s internal infrastructure using OpenStack technology, which allows the construction of virtualized services infrastructure.


  1. OpenEO

The OpenEO project started in October 2017 in order to meet the need to consolidate available technologies for storing, processing and analyzing large volumes of EO data. This demand arises from the difficulty that many users of EO data have in migrating their data analytics to cloud-based processing platforms. The main reason is not, in many cases, of a technical nature, but the fear of becoming dependent on the provider of the chosen platform. OpenEO aims to reduce these concerns, by providing a mechanism for scientists to develop their applications and analyzes using a single standard that can be processed in different systems, even facilitating the comparison of these providers. With this approach, OpenEO aims to reduce the entry barriers for the EO community in cloud computing technologies and in big EO data analysis platforms.

To this end, this system has been developing as a common and open source (https://github.com/Open-EO) interface (Apache license 2.0) to facilitate the integration between storage systems and analysis of EO data and applications of the European program Copernicus.

Text extracted and copied from Gomes, V., Queiroz, G., & Ferreira, K. (2020). An Overview of Platforms for Big Earth Observation Data Management and Analysis. Remote Sensing, 12(8), 1253. https://doi.org/10.3390/rs12081253


Saturday, 28 August 2021

Notes: SAR - distortions

continued from: SAR Basics

 Distortions:

  • Foreshortening,
  • Layover,
  • Shadow


Foreshortening: 

  • mountain appear as if leaning towards the sensor 
  • sensor facing slope foreshortened in image
  • decreases with increasing look angle


Layover: 

  • top of the mountain imaged before the base
  • mountain top overlain on ground ahead of the mountain
  • decrease with increased look angle


Shadow: 

  • area behind the mountain
  • increases when the angle is large


Speckle Effect: grainy appearance: salt and pepper - due to the result of interference from the many scattering echoes


___


Geocoding and RTC processing:

  1. Read in data
  2. Apply precise orbit files
  3. Radiometric Calibration
  4. Multilooking (optional)
  5. Speckle filter (optional)
  6. Radiometric terrain flattening
  7. Geocoding / geometric terrain correction
  8. Linear to decibel conversion (optional)
  9. write data in desired format


The above contents has been the attempt to prepare the excerpt from the book " The SAR Handbook" Ch-2 while trying to learn. The chapter has the very minute details and information for every avid individual interested in SAR. The contents
written above does not fully capture the whole chapter for sure.


Thursday, 6 May 2021

NASA's EOSDIS

NASA's EOSDIS stands for Earth Observing System Data and Information System. For this system, NASA's Distributed Active Archive Centers (DAACs) are scattered all around the USA. These centers work on processing, archiving, documenting, and distributing of the Earth Observation Data with the prime objecitve of the acessibility of the data in easiest possible way. 

There are 12 DAACs each specializing in their unique functions.


~ Alaska Satellite Facility (ASF) DAAC: works on SAR Data,


~ Atmospheric Science Data Centre (ASDC): data relates to earth and the atomsphere,


~ Crustal Dynamics Data Information System (CDDIS): data relates with geodesy such as GNSS,


~ Global Hydrometerology Resource Center (GHRC) DAAC: focus on lightning, tropical cyclones, storm induced hazards,


Goddard Earth Sciences Data and Information Services Center (GES DISC): data relates with global climate such as atmospheric composition, precipitation,


Land Processes DAAC (LP DAAC): data relates with the land processes,


Level 1 and Atmosphere Archive and Distribution System (LAADS) DAAC: data related to MODIS products,


National Snow and Ice Data Center (NSIDC) DAAC: data relates with snow and ice processes,


Oak Ridge National Laboratory (ORNL) DAAC: data relates with the biogeochemistry, ecology and environmental processes,


Ocean Biology DAAC (OB.DAAC): satellite bases ocean biology data,


Physical Oceanography DAAC (PO.DAAC): oceanographic and hydrological data,


~ Socioeconomic Data and Applications Center (SEDAC): Earth science and socioeconomic data,


More:

Saturday, 1 May 2021

Yield Gap Analysis Using Remote Sensing (Northwest of Iran)

The difference between the actual yield and the potential yield are the main concepts used in the yield gap analysis. The potential yield or the theoretical yield is the yield that could have been achieved in the optimum conditions whose  level upto 70% (called attainable yield) is considered to be possible to be achieved from the best practices. The actual yield, usually estimated at the end of the growth period of the crops, are the real or the observed yield. All factors, biotic or abiotic and crop management factors, are involved to limit the potential yield (estimated by the crop models). 

The objective of estimating the yield gap is to point the factors responsible for the difference between the yields, and for sure the other objective is the determination of the potential and the actual yields. The gap analysis methods involve ***calculation of the point ot regional based yield by the field experiments*** or ***by the simulation of the spatial and temporal surveys***. 

Current research have utilized the remote sensing techinques for the crop yield evaluation. The advantage remain in the spatial data at large scales and outputs to be processed as the models. The use case is Normalized Vegetation Index (NDVI) for the estimation of the actual yield.

A study entitled "Yield Gap Analysis Using Remote Sensing and Modelling Approaches: Wheat in the Northwest of Iran" utilizes boundary-line analysis to estimate the attainable yield and alter the yield response to the different factors. The research uses the SSM-iCrop2 model to estimate the potential yield, and also calculates the achievable yield by the boundary-line analysis and satellite imagery oriented procedures. 

Method

Study Area: 
Golestan Province, Iran (6 counties)

Data: Climate, Soil, crop management information, land use layer, Landsat 8 satellite imagesfor SSM-iCrop2 modelwheat fields by Supervised Classificatin Method (SVM)generation of NDVI map.

*radiometeric correction*, *radiometric calibration* and *gap fill tools* done in ENVI 5.3,
*atmospheric correction* by transforming DN (digital value to refelection energy and reflectance using) FLASH algrorithm

~ 234 ground points (70% for the training and 30% validation),
~ four crop categories for detection of the wheat fields: wheat, barley, canola. other crops.
Classifaication accuracy by Kappa 
~ NDVI layer generated, relationship between actual recorded wheat yields and NDVI established

NDVI data (dependent variable) and actual yield as independent variable were plotted against each other; omission of the outliers were done, suitable function was fitted to the dataactual yield calculated using obtained function - yield gap by subtracting the average yield of the studied farm from potential yield. 

SSM-iCrop2 Model: requires daily meteorological data, soil map HarvestChoice Soil Map

~ attainable yield by two procedures: i) estimating by SSM-iCrop2 model and defining attainable yield as 70% of the potential yield  ii) estimation of the attainable yield by NDVI-actual yield regression line by boundary-analysis

Result

Actual yield were calculated, line fitted between actual yield and NDVI values found May to have the best regression relations. The relations between maximum yields of wheat and NDVI were explained by linear function. The maximum yields were chosen above the fitted line (yield points below were though to have been due to the crop management practices). The map of the attainable yield from relationship between actual yield and NDVI  (using boundary analysis) was generated. The SSM-iCrop2 model predicted higher compared to boundary-line analysis. 

The suggestion is that the actual yield could have been improved by two times, and author attempts in explaining the difference in dfferent yields based on the environmental reasons . Overall, the process summarizes with the NDVI and its relation was with actual yield was studied obtaining the equation using the boundary-line analysis (which estimated the attainable yield at the large scale). 

The author points the output of the simulated models to be discrete, plant parameters to be calibrated well, need of the meteorological data, requirements of the soil data, unreliability from unreliable inputs, and sometimes unrealistic yield estimates. The direst advantage of the satellite images is the possibility of the determination of the effect of the different factors and the detection of the area with the lower yield, and their causes. The use of the satelllite imagery based indices and the crop models can be valuable estimation tool for the agricultural systems.

In An Attempt to study and summarize:
Dehkordi, P.A., Nehbandani, A., Hassanpour-bourkheili, S. et al. Yield Gap Analysis Using Remote Sensing and Modelling Approaches: Wheat in the Northwest of Iran. Int. J. Plant Prod. 14, 443–452 (2020). https://doi.org/10.1007/s42106-020-00095-

Thursday, 29 April 2021

C-band SAR for Crop Types Classification

Crop information provided should be timely, geographically representative over the larger area, robust while improving itself with the ever changing needs, developments and the new research. Current research in SAR, which measurers intensity and scattered energy from the target surface, has recevied attention in the areas of agricultural monitoring. Its ability to work even in the presence of the clouds is the additional advantage, while the crop structures and the water presence in the vegetable canopy influence how the wavelengths are scattered. C-band along with optical imagery has resulted higher accuracy in determing crop types. The cropping systems to be classified; however, are complex due to different crop growing period, time and the types of the grown in the specific geography. It suggests the research to be focused on the *sensors*, *number of optical images required*, and *timing of receving the image*. 

A research was conducted to understand *how the C-band data can map crop types around different agro-ecosystems*, based on frameworks of JECAM (Joint Experiment for Crop Assessment and Monitoring), a branch of GEOGLAM: an initiation from G20 initiative to improve global agri. monitoring using EO data. Decision Tree (DT) and Random Forest (RF) classifier were tested and mapping accuracies were evaluated compairing with "optical only" and "optical and SAR" satellite data.

DT and RF classification:

The research used  the classification methodolgy developed by AAFC (Agriculture and Agri-Food Canada) who develops the ACI (Annual Space-Based Crop Inventory).

DT has been used in multiple cases of land used classifications which is also applied by USDA to prepare annual CDL (Cropland Data Layer). DT are non-parameteric models and works in discrete data providing classification rule sets. 

RF also being non parametric classifier has been found to be successful in many agri. monitoring cases with high classification accuracies compared to MLC (Maximum Likelihood Classification) in some cases. RF works by  creating multiples DTs where training data and predictive variables are branched in many numbers, from which individual trees are grown; each tree ending in end-nodes classes results in the one, which have the highest votes among all end-nodes.

Cloud presence decreases the accuracies of the classification of the optical imagery. For this, ACI has been built to process both C-band SAR and optical image data. 

Sites and Data Collection:

a. Sites

10 sites from JECAM countries participated in the study. Crop classes in each sites were from 3 and 10. Field data were acquired form in situ survey methods where vehicle-based survey of the agri. fields was done with recordings of the crop type and the location. The point observations were assigned to field-sized polygons. Classes were assigned to the polygon.

For USA sites, field data were derived from USDA CDL, the products which are developed and continuously refined over the last 20 years. 

b. SAR and optical data:

Sentinel-1 SAR data:  Interferometric Wide (IW) Ground Range Detected (GRD) high-resolution mode (spatial resolution: 20 m, image swath: 250 km)

RADARSAT-2 data: multiple modes 

  • Wide 2 (W2) ground range product (SGX) resolution of 20 m and 150 km swath; 
  • Wide 3 (W3) single look complex (SLC) resolution of 13.5 m × 7.7 m and 130 km swath
  • Standard mode beams (1 to 7) SLC resolution of 13.5 m × 7.7 m and 100 km swath; 
  • Fine Quad Wide (FQW) and Fine Quad (FQ) SLC products, resolution of 8 m and 50 km and 25 km swaths, respectively
Landsat 8 and Sentinel Optical Imagery: cloud free data as possible


Methods:
Preprocessing steps For SAR data were, processed in Sentinel 7.0, and steps were followed as suggested in Dingle Robertson et. Al. (2020)
  • application of orbit file (Sentinel-1 data): exact sensor position and platform velocity is needed, provided by Sentinel 1 product  metdata, is applied to locate image acquisiton. Orbit state vectors are already applied to RADARSAT-2
  • speckle filtering: Gamma Maximum A Posteriori filter (11*11 m window) was applied, which assumes the speckle noise to be in  the Gamma distribution.   
  • terrain correction using an elevation derivation model (ortho-rectification): The effects of the angle and terrain are removed and the image is corrected according to the known coordinate system. 
Optical Data: The optical data were pre-processed using Senitinel 2 for Agriculture Project (SEN2AGRI) system. The pre-processed SAR and optical dadta were placed as three data stacks per site, resampled ot 20 m using bilinear functin and clipped to JECAM sites.

The optimized SAR and optical combined data stacks were created based on *the one optical and one SAR image per month of the growing season*, *best images which covered all full site spatial coverage or no clouds for optical imagery*, *band selection: six bands for the optical imagery, and VV and VH for SAR imagery*, *SAR data with the rainfall on the day were excluded*.

Classification:
The DT and RF classifier were applied to each three data stacks for each JECAM site. The See 5.0 DT parameters weter set and for RF 150 trees and 10 variables were set to improve the processing time. Accuracy were accessed by the error matrix. OAs anfd  users and producers accuracies were focused. 

Results and Conclusions:
RF classifer was found to have higher accuracy. The OAs tend to fall with the decrease of the number of the SAR images. The SAR only data were not found to have more superiority over the optical data classification. The timing of image acquition is also likely to influence overall classification accuracy. Similarly, the increase in the number of the crops to be classifed also decreased the overall accuracy. 

The overall implication is the application of SAR imagery when the cloud free optical imagery is not available. The optimized combined data stack was proved to produce higher accuracies across the classes. In the cases where, the growing period is missed, the lower accuracies were achieved. 


In an attempt to study the following article:
  1. Laura Dingle Robertson, Andrew M. Davidson, Heather McNairn, Mehdi Hosseini, Scott Mitchell, Diego de Abelleyra, Santiago Verón, Guerric le Maire, Milena Plannells, Silvia Valero, Nima Ahmadian, Alisa Coffin, David Bosch, Michael H. Cosh, Bruno Basso & Nicanor Saliendra (2020) C-band synthetic aperture radar (SAR) imagery for the classification of diverse cropping systems, International Journal of Remote Sensing, 41:24, 9628-9649, DOI: 10.1080/01431161.2020.1805136
 

Monday, 26 April 2021

Remote Sensing for Estimating Crop Area

Crop Area and Crop Yield are the two main required parameters for the crop information. Crop area estimation are assumed to be simply easier when the two parameters are compared, while this is usually not true. Different factors significantly impact the crop area estimation and making the process relatively arduous; such as field size, different cropping system, differences in phenology, and sometimes due to damage from weather and pests, while crop area estimation are to be taken at multiple growth stages of the crops. 

The notable review of the crop area estimation comes from Crag and Atkinson (2013): crop area estimated is done by complete inventory of all the farms or by the samples. The sampling can be Area Frame Sampling (AFS) or farm list sampling or combination of both. In all cases, experts opinions are usually seeked. 

The traditional estimation measures, as mentioned above, are time-taking, involves high-costs, difficults in its ways, and human errors are likely. For overcoming these, satellite remote sensing has been used directly or partially to support area sampling. Satellite remote sensing provides different images of the land use and helps in different usages for crops.

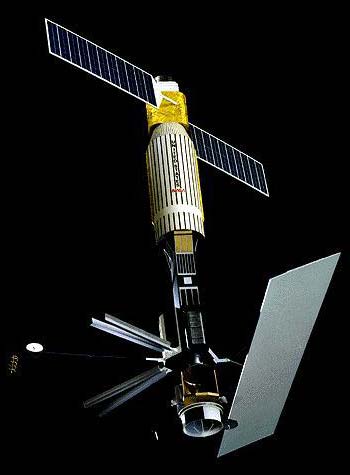
The history of satellite based remote sensing for crop area estimation started from the early 1970s when Corn Blight Watch Experiment was carried out by USDA, NASA and involvement from different univeristies. ERTS-A was lanched in 1972 which studied the applicability of multispectral remote sensing technology: Crop Identification Technology Assessment for Remote Sensing (CITARS) and Large Area Crop Inventory Experiment (LACIE) were conducted for the study of capabilites of remote sensing in the crops contexts. LACIE was sponsored by United States of America and relied on Landsat data to estimate wheat production. It was later extended to Canada and former Soviet Union. LACIE was followed by Agriculture and Resources Inventory Surveys Through Aerospace Remote Sensing (AgRISTARS) which included other crops. 

1. LACIE

LACIE was the joint programme of NASA (NOAA) and USDA which operated to demonstrate the feasibility to study Landsat data  in agricultural assessment programmes. It was the exemplary model for upcoming experiments. Conducted in three phases, LACIE worked in crop, yield and area estimation of the crops in different modes: quasi-operational and feasibility test mode; the third phase worked for crop forecasting for wheat crop yield at country level.

The applicability of the Landsat was in improving the area sampling frame (AFS) and the regression estimation of the crop areras.

2. Approaches using Remote Sensing

Crops being different (in structure, physiology, phenology) provides different spectral signatures. Ground truth (selected ground information) are used to help in identification of crops. This concept is applied in: ASF Design, Direct estimation or pixel counting, regressioin estimator and calibration estimator

a. ASF design:

Satellite data provides the reference for elaboration for the population frame; areas of interests are divided into enumeration area (EAs). The crop proportion is derived from remote sensing data which is used to characterize spatial cariability and serves as a parameter for stratification for area frame sample design. Area frame can be with physical boundaries or be wtih regular shape.

In simple terms, it is to classify the digital image based on the crops, the grids are overlaid on the classified image. Each grid (can be square or others) is further classified based on the crop proportions. From each classificaatin sample segments are selected for final analysis. 

b. Direct Estimation:

The satellite image is classified from ground truth from sample locations. The number of pixels (within the boundary for each crop) is multiplied by the pixel size.

c. Multidate Data Analysis:

Based on the differences in the phenology of the crops, the spectral signatures are different. Moderate spatial resolution but temporal data is used for this purpose, where decision rule classification process is applied for the crop classification based on decrease or increade in NDVI.

d. Single Date Data Analysis:

Higher resolution satellite data is used in which ground truth information is used for the crop signature classification. The pixels are classified under a particular crop, pixels area is multipled with the number of pixels to obtain the crop area under the  boundary.

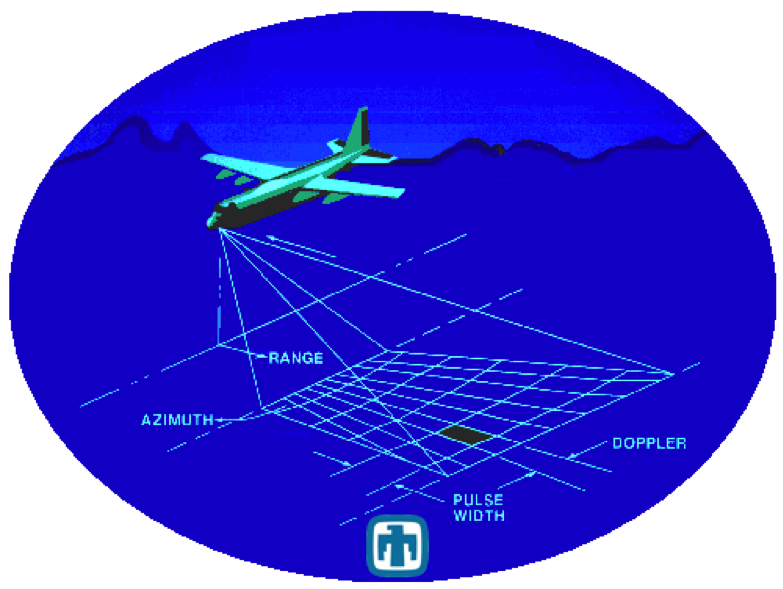
e. SAR Data for crop area estimation:

The cloud cover is addressed by the use of microwave SAR data which are based on the backscatter values. There is increase in the backscatter from the early stage to later stage in the plants, and later gets constant. This application remains mostly in rice fields. 

f. Ground Truth Data;

The use of mobile applications are common in the ground truth collection. The ground truth data collection includes geographical location, village, district, state, name of the crop, coverage, condition and so on.

f. Accuracy Estimation:

It is the actual or reference class and the predicted or classified pixels in columns and rows where the performance of the visualization is classified.  

g. Regression Estimator:

It is applied as hybrid based approach with other integrations.

h. Calibration Estimator:

The confusion matrix is used to readjust the pixel count area. Confusion matrix is computed using ground information on a sample of points or segements and the correction of extrapolation.

i. Small Area Estimaor:

This include statistical apporaches and spatial microsimulation approaches which further may have different approaches within them.

3. Crop Area Estimation Programmes:

a. National Level:

USDA/NASS's CDL: The USDA/NASS works in providieng the agriculture statistics in USA. 

FASAL programme: The FASAL programme (launcehed in 2007) works on providing different crop forecasts in the national level. 

b. Regional Programme:

EU/JRC's MARS Programme: It works on the regional crop inventories and estimation of the crop area change at EU level.

c. Global Programme;

CropWatch (China): Developed by Institute of Remote Sensing and Digital Earth (RADI) and Chinese Academy of Sciences (CAS), it works on the global, regional, national and subnational levels. 

USDA/FAS: It works on crop condition assessments for 159 countries. 

GEOGLAM: It works on providing the framework strengthening the capability of the international community to forecast agricultural production. 

3. Cost Effectiveness

The satellite data cost, ground truth collection and analysis cost are the cost involved in the remote sensing. The cost is benefitly reduced while achieving more accurate and timely results. 

4. Limitations

The difficulties can be related towards field size, cloud cover, different crop practices. However, the reduction of the cost in the overall process is the main advantage in the whole process. 


~As extracted from "Handbook on Remote Sensing for Agricultural Statistics" Ch: 5

Sunday, 18 April 2021

SAR: Basics

RADAR or RAdio Dectection and Ranging  is believed to have started at the beginning of the 20th century whose credits go to German inventor Christian Huelsmeyer who had developed the system to develop the system to detect distant metallic objects, OR British enginner Robert Watson Watt who had object detecting system far up to 30km. The technology emerged during World War II and the developement of which has then had developed further to be kept on the airplanes by 1940s. Its applications grew even in the areas of Earth Observation.


The advantage of the RADAR system always remained in its utilizations with disregards of weather or any time of the day or night. The surface was interacted differently according to radar signals with more information about the surface. Side Looking Airborne Radar (SLAR) systems developed around in 1950s, where the radar sensor mounted on the platform moved in the straight line at altitude H and the radar system points to the nadir at the look angle a. The area illuminated at the ground is called antenna footprint; illuminated by the short microwaves pulses of pulse length t. The size S of the footprint is dtermined by the system wavelength and the side length of the antenna L and slant height R;

 S ≈  wavelength/L*R

The two dimensional image are distinguished from the arrival time. Objects at different ranges can be distinguished only if their range separation is half their transmitted pulse length. The range resolution is given by; Pr = (c* t)/2 where c is the speed of the light. The resolution refers to the system's ability to differentiate the two objects at different slant distances.

The ground based resolution is given by Pg = Pr/ sin(a); which refers to the improvement with the increase in a and not constant across the  swath; howver the ground resolution decreases with increase in a. The azimuth resolution in SLAR is dependent upon the footprint in SLAR system which is limited by the side length L. The dependence to R makes it impractical in space borne satellites which requires increase in the length of the antenna. Howver, maximum antenna length is unreasonable; for which Synthetic Aperture Principle was developed in 1952. SLAR system is equally popular in ground based and airborne applications.


SAR works with creating linger synthesized antenna called synthetic aperture from the shorter antenna while moving along. This allows high resolution imaging even in the spaceborne platoforms. The object on the ground is imaged by consecutinve radar pulses consecutively, which when later post processed results the image to have acquired from the single longer antenna. Its resolution is higher than SLAR images.

Geometric distortions in SAR data include foreshortening, layover and shadow which are due to oblique observation. In radar image, the tall objects such as mountains wouls appear to be leaning; this is called foreshortening. In the layover, the tops of mountain are imaged ahead of the base. And the shadow is increased due to larger a. 

The other radiometric properties within the SARimage include speckle (salt and pepper noise) which occurs due to scattering events or interference. Speckle is multiplicative noise i.e. not constant within the image. Many filtering methods have been developed to address it. 

Radar Cross Section (RCS) is the rato between the inicdent and received signal intensity of microwave signals, which is recorded by SAR. The RCS is influenced by surface roughness and dielectric properties of the imaged object. The senor wavelength determines penetration, for instance; C and L band being able to penetrate deeper in to the vegetation and sometimes in the density of the canopy. Similarly, the roughness is also determined according to wavelength of the sensor. 

In SAR, the orientation of the plane of the oscillation of the propagating signal can be controlled. This is called as polarization and the sensors can transmit the signals at different polarization. HH, for instance refers to as Horizontal Polarization - transmit and Horizontal Polarization - receive. Current senors provide the abilities in providing different polarization capabililies bringing HH, HV, VV, VH polarized imagery. The visibility is enhanced by HH, VV and HV is combined as the single RGB image. 

Seasat, first earth observing satellite


The first SAR was NASA's Seasat satellite, launched on June 28 1978, had HH polzrized L-band SAR which had objectives to study oceans conditions. Seasat was considered was successful and after ERS-1 in 1991, more and more SAR sensors have been launched; however, making data from different sensors not being incompatible.  

The SAR system uses frequencies from 1 to  90 GHz whose names have been developed from World War II, during the period where microwave remote sensing was being developed heavily. Certain frequencies withhin are further divided naming the bands and their applications differ according to their penetrable capabilites. C-band sensors have been popular form the past three decades. Further developments are likely to be sesen in L and P based sensors.

SAR data types include:

SAR RAW Data: They are the raw observed information made by sensor.  They are refereed as L0 data. 

SLC (Single Look Complex Image): It includes the information with amplitude and phase informaton stored. They are refered as L1 data. 

Detected Amplitude Images: They are fully focused image. They might be in various geocoding stages. They are categoried as L1 detedted images. 

Polarimetric Products: NASA JPL run airborne remote sensing provides two data types: Compressed Strokes Matrix and Pauli Decomposition Matrix

Level 2 products: data products that are have been projected to the ground and transformed into physical varaibles. 

SAR Data: Most systems operate on free and open data policy. 

The process of correcting the angle a is called Radiometric Terrain Correction (RTC) and Geometric Terrain Correction (GTC) includes the removing the geometric image distortions. 

The SAR applications include on Interferometric SAR and change dtection.


 This animation, comprised of images acquired by Envisat’s Advanced Synthetic Aperture Radar (ASAR) between 30 May and 9 June 2008, highlights the rapidly dwindling strip of ice that is protecting thousands of kilometres of the ice shelf from further break-up. This is the first ever-documented episode to occur in winter.
Source: Commons


The above contents has been the attempt to prepare the excerpt from the book " The SAR Handbook" Ch-2 while trying to learn. The chapter has the very minute details and information for every avid individual interested in SAR. The contents written above doesnot fully capture the whole chapter for sure.

SDGs in Nepal

Achieving the Sustainable Development Goals (SDGs) in Nepal by the 2030 deadline is a major national aspiration but also a complex challeng...